Page 1
TCPmaker projects are guaranteed to work as they were generated, or we will make it right.
However, the code that TCPmaker generates does not do any hardware dependent I/O other than that needed to run the Microchip TCPIP Stack, so you must add at least a little bit of code to light up LEDs, read ADC channels, and so on. If your application is complex, though, you may need to add a fair amount of your own code in order to implement your application fully.
We have already discussed the fact that the Microchip TCPIP Stack, and TCPmaker’s software on top of it, both use Cooperative Multi-Tasking. That means that if you add some code of your own that breaks the rules, perhaps by waiting in a wait loop for some time consuming mechanical movement to complete in your application, then you might bring the whole process to a screeching halt under some circumstances.
In general, mistakes will happen during a development process, so TCPmaker Pro provides a diagnostic tool called mtDebug.exe, which makes it very simple to see the traffic going between your TCPmaker device and the display in your PC browser.
Page 2
You may be familiar with general purpose network debugging tools, like Ethereal (now called XXX.) If you want, you can certainly use tools like those to test your TCPmaker project, but you'll find that these will be hard to work with.
The reason is that those tools are so general that they can capture and display ALL the traffic on your network, between ALL devices on your network, and show messages in ALL the ethernet protocols. Try using a tool like that sometime, and you'll probably be amazed at the huge amount of traffic that is going across even a small private network, all the time.
You'll discover that it will be very difficult to find just the message traffic to your embedded web server device, hidden as it is among all that other traffic.
You'll also find that these general purpose network debugging tools provide information on all the protocol layers that are present in every packet. This is great capability when you need it, but you'll find that it becomes difficult to sift through all that information to isolate the problem on your one device.
Page 3
mtDebug keeps thing simple by interposing itself between your running device and the browser display on your PC. It captures just the traffic you need, and displays it in a simple format: the TCPmaker message pump data that travels between your browser display and your device under test.
While it is doing this, you can see and interact with your TCPmaker design layout in your browser, just as you normally would.
While mtDebug is extraordinarily simple to learn and use, it provides powerful features to help you figure out the problem. With mtDebug, you can:
- log the data to the mtDebug window
- type comments of your own into the data, to document your work
- save the data to a file
- print the data
- clear the data
- optionally display the time in milliseconds that each message was sent or received by the PC. (ON by default)
- interrupt the logging whenever you want, in order to capture just the circumstances that cause the problem.
Page 4
Here are the steps you need to take to prepare your TCPmaker project for testing:
None!
That's right, you don't need to do anything special to set up your project to use meDebug. Traffic from any TCPmaker can be viewed with mtDebug. All you need is for that project to be working just well enough to be able to serve up your TCPmaker layout and display it in your browser.
(If your project won't do that much, then you have some lower level problem: perhaps a problem with your board, or with the way you have configured the Microchip TCPIP Stack, or a network problem.)
Page 5
To start your test, power your device and connect it to the ethernet cable as you normally would, but don't run the browser.
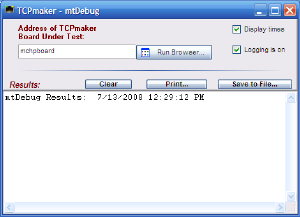
Instead, run the mtDebug program, and you will see this:
Click on the image for page view.
Page 6
At startup, the edit box labeled "Address of TCPmaker Board Under Test" contains the default NetBIOS name that the Microchip Stack sets for your device. If you have changed that NetBIOS name, you can replace it with your new NETBIOS name in the edit box.
Alternatively, you may type the IP address of your device, e.g. 192.168.1.3
DO NOT TYPE THE HTTP:// PREFIX IN THE ADDRESS BOX: mtDebug will take care of that for you.
To start the test and log the data, just click the Run Browser... button.
Page 7
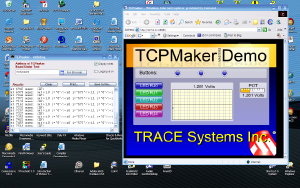
When you do this, you will see that the browser starts, connects your device, and starts running the message pump.
In the mtDebug Results box, you will see a flood of message traffic displayed, which is the TCPmaker message pump traffic between your device and the PC browser.
(For this screen shot, we've temporarily un-checked the "Logging is on" checkbox to temporarily stop displaying data. Note that unchecking the "Logging is on" checkbox does NOT stop your device or its message pump: it only stops capturing and displaying data.)
Click on the image for page view.
Page 8
Here is what the message data looks like for this device. (The second line may be folded over on your screen, unless you enlarge this window.)
<-PC at 5945 msec: <LF>
->PC at 5966 msec: <mt><i0 i="0"/><n0 i="573"/><i1 i="0"/><i2 i="0"/><i3 i="0"/><i4 i="0"/></mt>
The first line starts with "<-PC" to indicate that this message is going OUT from the PC to your device. The time "at 5945 msec:" is the elapsed time in msec since we started logging data. (If we like, we can turn off the display of time by unchecking the "Display times" checkbox on the mtDebug window.)
The content of the first message is shown after the colon: <LF> indicates just a heartbeat signal to keep the connection alive, but no data was sent from the PC this time (because we didn't click any buttons or other controls on our layout).
The second line starts with "->PC" to indicate that this message is going IN to the PC from your device. The arrival time of this message is shown, and after the colon, we see that this message contained some data.
Page 9
Our message data was:
<-PC at 5945 msec: <LF>
->PC at 5966 msec: <mt><i0 i="0"/><n0 i="573"/><i1 i="0"/><i2 i="0"/><i3 i="0"/><i4 i="0"/></mt>
Let's take a look at the format of the data in that second line. The message data is encoded in a simple form of XML, which stands for Extensible markup Language, which is sort of a general purpose cousin of HTML or Hypertext Markup Language that is used in web pages.
Notice first that the whole message begins with <mt> and ends with </mt>
Notice also that, between these beginning and ending snippets, we see several sections that look like this:
<i0 i="0"/>
You've probably already figured out that this message sends the current value of the integer variable whose ID is i0. The value is shown in ASCII format inside the quotation marks: "0" in this case.
So, you've probably already figured out that the second line of captured message traffic shown above is telling the PC the current values of variables whose IDs are i0, n0, i1, i2, i3, and i4. These values are all 0 except for n0.
In our particular project, variables i0...i4 happen to be integer variables associated with the 5 rectangular pushbuttons on our TCPmaker layout, each of which is intended to light up one of the LEDs on the PIC device when we push the corresponding button on the browser. The PIC code is set up to also report the current values of these variables (i.e. the current states of the LEDs) in response to each message from the PC (even an empty message). We haven't pushed any buttons on the browser screen, so no LEDs have been lit up, and all these integer variables are 0.
The Numeric variable whose ID is n0 is used to carry the current position of a pot on the device. Its reported value of "573 " indicates that the pot is somewhere in the middle of its 10-bit range. If we turn the pot as we log data in mtDebug, we'll see this value change as the browser display updates the state of the Horizontal Gauge and oscilloscope Plotter that are associated with this variable.
Page 10
The raw message format is pretty easy to understand. So how do we use this to find and fix problems with our device?
If your device isn't working right, you can look at the raw message traffic with mtDebug and see if data is missing, or malformed, or if the values being reported are outside of the range that you would expect.
For example, if your device always reports a value of 0 for a pot, no matter how you turn it, then you can focus your attention on the pot circuitry or the specific parts of the software that are supposed to read it and report its value.
If the value of the variable for your pot is never sent at all, then perhaps you forgot to add something important to the code that TCPmaker generated for you.
Suppose your device has problems only under some specific circumstances: for example, when you push a certain button. You can run your device under the control of mtDebug with logging off until just before you trigger the problem. Then, turn on logging, push the button to trigger the problem, and you'll capture just the message traffic you need.
Page 11
TCPmaker Pro's mtDebug tool provides a simple but powerful way to diagnose problems with your device:
- mtDebug shows you just the traffic you need to see: the data to and from your device only, without confusing you with all the other traffic on your network.
- You don't need to do anything to prepare your TCPmaker device for mtDebug.
- While you are logging data, you can see and control your device with the same interactive browser display that you designed yourself.
- The format of the raw captured data is easy to understand.
- Captured data can be time stamped.
- You can type comments into the captured data display, to document your work.
- Captured data can be printed and/or saved to a file.
- Data logging can be turned on and off to help you capture just the right data, to help you figure out the problem fast!
|